
Williams %R
User can add Williams %R indicator to their chart by right click the chart and select Study Config to open the study configure window first, then select the “Williams %R” from the study list and add it into the Studies In Chart field.
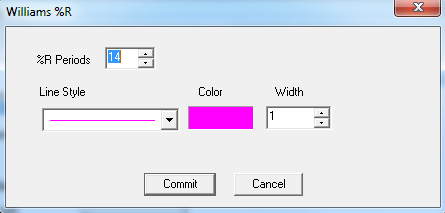
Williams %R Configure window allows user to modify the Williams %R chart, such as change the study period and line’s color. User can open this Williams %R Configure window either by click the “Config” button or double click the study “Williams %R” under Studies In Chart section.
Explanation of Each Field
· %R Period: Allows user to adjust the study period for Williams %R study.
· Line Style: Allows user to use the dropdown menu to change the line style.
· Color: Click the color field allows user to change the line color.
· Width: Allows user to adjust the line’s width.