
PivotPoint
User can add Pivot Point indicator to their chart by right click the chart and select Study Config to open the study configure window first, then select the “PivotPoint” from the study list and add it into the Studies In Chart field.
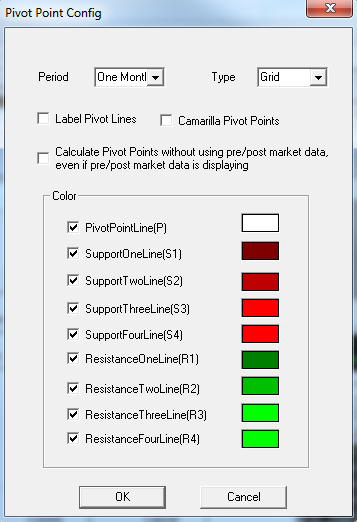
Pivot Point Configure window allows user to modify the Pivot Point chart, such as change the study period and lines’ color. User can open this Pivot Point Configure window either by click the “Config” button or double click the study “PivotPoint” under Studies In Chart section.
Explanation of Each Field
· Period: Allows user to adjust the study period for Pivot Point Study.
(Hint, the number are represents the number of bars.)
· Type: Allows user to change the chart type.
Ø Line: Select this to use the line chart.
Ø Grid: Select this to use the grid chart.
· Label Pivot Lines: Check off this box to add labels to the pivot lines.
· Camarilla Pivot Points: Check off this box to use the camarilla pivot point
· Calculate: Check off this box to calculate the Pivot Points without using pre and post market data, even if pre and post market data is displaying in the chart.
· Color Section: Click on the color field allows user to change the associate line’s color, and check off the associate boxes allows client to add those lines to the chart.